 The frontier AI for IT work
The frontier AI for IT work
The frontier AI for IT work
One month of service desk data shows a clear path from today’s 25% modeled automation coverage to 66% near-term coverage—unlocking 411 hours of technician capacity per month from 934 non-alert tickets.
Analysis period: April 1–30 · Figures are modeled from the source service desk analysis and represent automation opportunity, not independently audited post-deployment savings.
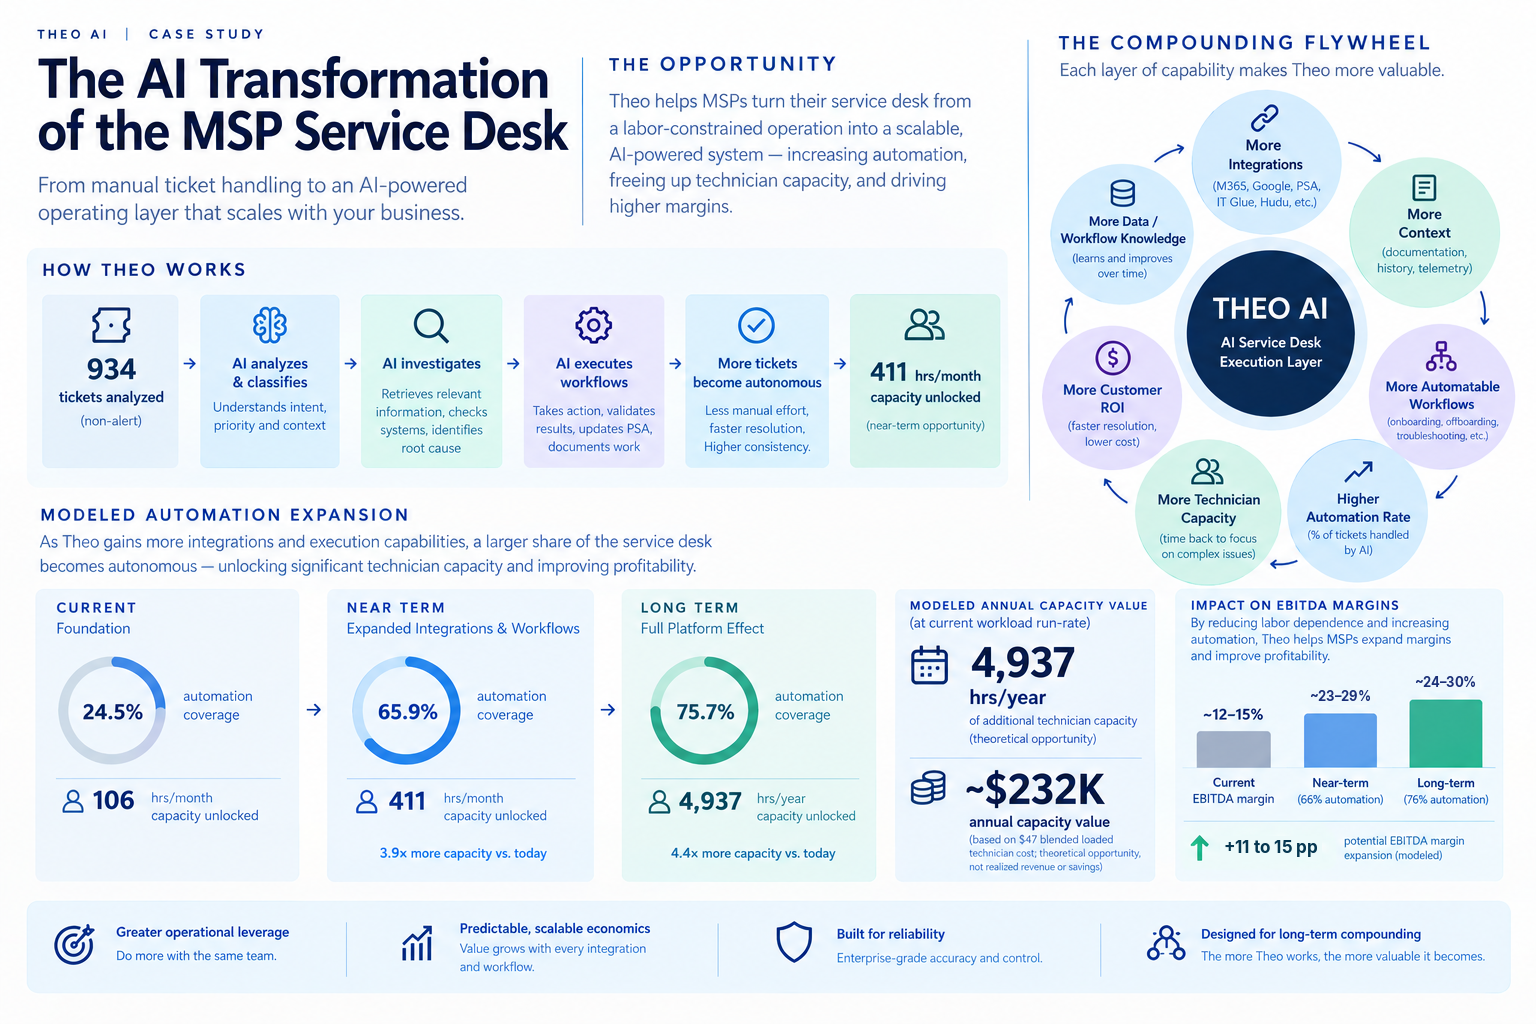
The analysis starts with the work MSPs already perform every day, then maps where AI can investigate, execute, and close repeatable tickets. The key investment signal is not one automated workflow—it is the expansion of automation coverage across the service desk.
17% of monthly workload is represented by current modeled capacity savings.
67% of monthly workload is represented by near-term modeled savings—an almost 4× expansion from the current state.
Recovered technician capacity creates economic leverage without requiring a linear increase in service desk headcount. At the same time, the expansion of automated coverage creates a repeatable deployment path for Theo across customers.
Application Support is the largest near-term source of capacity because each ticket consumes substantially more technician time than the highest-volume categories.
The opportunity expands as Theo connects more context and execution capabilities to the same service desk workflow.
Ingest ticket context, documentation, user data, and signals from the MSP tool stack to determine what the issue is and what information is missing.
Classify the work and determine whether the ticket can be safely handled through an existing workflow, investigation path, or human escalation.
Use integrated systems and workflows to perform the work—not just recommend the next step.
The modeled roadmap moves automation coverage from 24.5% today to 65.9% near term and 75.7% long term.
The table below preserves the underlying analysis while making the automation opportunity easy to evaluate by service desk category.
| Issue type | Tickets | Ticket hours | Near-term automation | Near-term hours saved |
|---|---|---|---|---|
| Application Support | 78 | 201.8 | 79% | 160.1 |
| Account Management | 212 | 94.1 | 87% | 82.2 |
| M365 / Collaboration | 92 | 55.8 | 57% | 32.1 |
| Access / Permissions | 89 | 39.5 | 71% | 27.9 |
| Email / Messaging | 167 | 58.3 | 47% | 27.4 |
| Google Workspace | 23 | 27.2 | 70% | 19.0 |
| Security Alert / Incident | 93 | 19.3 | 88% | 16.9 |
| Device Management | 33 | 24.2 | 65% | 15.7 |
| Printer / Peripheral | 20 | 16.5 | 56% | 9.3 |
| Ambiguous / Insufficient Detail | 19 | 9.5 | 83% | 7.8 |
| Network / VPN | 38 | 25.7 | 20% | 5.1 |
| Hardware / On-site | 35 | 18.9 | 19% | 3.6 |
| General IT / Other | 23 | 5.5 | 60% | 3.3 |
| Cloud / Infrastructure | 9 | 10.6 | 10% | 1.1 |
| Backup / DR | 3 | 3.5 | 0% | 0.0 |
The source analysis identifies two concrete dependencies for reaching the near-term automation level.
Complete the Avanan integration identified in the roadmap to expand automated handling of relevant security and messaging work.
Add RMM connectivity to enable deeper investigation and execution for device and infrastructure tickets.
Use ticket volume and hours-per-ticket to prioritize workflows where automation releases the most technician capacity.
Measure automated resolutions, technician time avoided, escalation rate and rework to validate modeled savings in production.
Based on the April ticket mix, the modeled near-term opportunity is 411.4 technician hours per month—equivalent to 67% of the analyzed ticket workload by the source model.
Modeled automation coverage expands as Theo adds workflows, integrations, and execution capabilities.
Modeled technician hours saved per month expand with the same underlying service desk demand.
From ~12–15% today to ~23–29% near term and ~24–30% long term, applying full-hours capacity to a $257k current EBITDA base. Modeled opportunity, not realized savings.